

At a glance: National benchmarks put commercial solar between $1.77 per watt DC (SEIA and Wood Mackenzie, Q2 2026, modeled) and about $2.40 to $3.10 per watt (Berkeley Lab 2025 reported medians, by system size). In Florida, system size is capped by usable roof area, FPL’s guideline of under 115% of annual consumption, and net metering tiers up to 2,000 kW AC. Payback turns on rate class: on FPL’s October 2026 rates a solar kWh offsets about 12.7 cents on GS-1 and about 6.3 cents on GSD-1. Roof condition, wind design, and tax-credit timing shape the rest.
Commercial rooftop solar cost in Florida is best judged per watt of DC capacity, against the utility rate class the building is billed on, and with the roof’s remaining service life priced in. A proposal that quotes a low price per watt but ignores the rate class or the roof can miss its payback projection by years, or force a remove-and-reinstall of the array halfway through its life. The national benchmarks published since August 2026 do not report a Florida-only commercial price, so this guide shows how to read them against a Florida bid, how system size is set, and which variables move payback. It does not quote Advanced Green Technologies pricing or promise a payback period for any building.
What Does Commercial Rooftop Solar Cost per Watt in Florida in 2026?
The most recent national benchmark puts commercial solar at $1.77 per watt DC. The SEIA and Wood Mackenzie Q3 2026 Solar Market Insight report reports that figure for Q2 2026, up 5.6% from a year earlier, and attributes the increase to elevated balance-of-system costs, including Section 232 tariffs on copper, steel, and aluminum and logistics costs that rose more than 15%. Over the same period, the report says distributed-market module prices fell about 16% to $0.37 per watt. At those figures the module is roughly a fifth of the benchmark price.
Reported prices run higher. Berkeley Lab’s August 2026 distributed solar and storage data update puts the 2025 median installed price at about $3.10 per watt DC for small non-residential systems (100 kW or less) and about $2.40 per watt for larger ones, in real 2025 dollars, before incentives. Berkeley Lab also reports that soft and balance-of-system costs are roughly 80% of the median price, and that medians differ by about $1.70 per watt across system sizes.
The two sources measure different things. Wood Mackenzie models a contracting price for a reference system, while Berkeley Lab reports what owners paid, with no separate Florida figure. A large, simple roof tends to price toward the modeled benchmark, and a small system on a complex occupied roof toward the small-system median or above it.
Table 1. Price-per-watt benchmarks
| Source | Figure | What it measures | Date |
|---|---|---|---|
| SEIA / Wood Mackenzie, Solar Market Insight Q3 2026 | $1.77 per watt DC | Modeled national commercial contracting price, before incentives | Q2 2026 data, published Sept. 2026 |
| Berkeley Lab, Distributed Solar and Storage 2026 Data Update | About $3.10 per watt DC (median) | Reported installed price, non-residential systems of 100 kW or less, real 2025 dollars | 2025 installations, published Aug. 2026 |
| Berkeley Lab, same update | About $2.40 per watt DC (median) | Reported installed price, non-residential systems above 100 kW | 2025 installations, published Aug. 2026 |
| SEIA / Wood Mackenzie, same report | $0.37 per watt DC | Distributed-market module price only, not an installed price | Q2 2026 |
How Is Commercial Solar System Size Set in Florida?
System size on a Florida commercial roof is set by three limits, and the smallest one governs: usable roof area, the building’s annual consumption, and the utility’s net metering rules. Usable area is what remains after fire-code setbacks, walkways, rooftop units, skylights, and shading are taken out. Advanced Green Technologies designs and builds commercial rooftop solar installations across Florida, and that layout step comes before any price.
Consumption sets the second limit. FPL’s net metering guidelines state that a customer’s renewable system must be estimated to produce less than 115% of annual kWh consumption, and they place systems in tiers by AC rating: Tier 1 at 10 kW and below, Tier 2 above 10 kW up to 100 kW, and Tier 3 above 100 kW up to 2,000 kW. FPL converts an array’s DC rating to AC by multiplying by 0.85. Investor-owned utility net metering is governed by the Public Service Commission’s Rule 25-6.065, Florida Administrative Code, and Duke Energy Florida and TECO apply it through their own tariffs, while municipal utilities and cooperatives set their own terms.
For scale, Berkeley Lab reports a 2025 median non-residential system of 41 kW (average 238 kW), with warehouses near 85 kW. A distribution center can have more roof than the 115% guideline allows, while a mid-rise office runs out of roof first; the guide to sizing rooftop solar for Florida warehouses covers dry and cold storage. Size should come from 12 months of interval data, a structural review, and a production model, as in AGT’s commercial solar engineering process.
Table 2. System size limits on an FPL account
| Limit | Set by | Effect on system size |
|---|---|---|
| Usable roof area | Roof layout, fire-code setbacks, rooftop equipment, shading | Physical maximum for the array |
| Annual consumption | FPL guideline: estimated production under 115% of annual kWh | Maximum size for net metering on FPL |
| Net metering tier | FPL tiers by AC rating (DC rating x 0.85) | Tier 2 is above 10 kW to 100 kW AC; Tier 3 is above 100 kW to 2,000 kW AC; requirements rise with the tier |
| Upper limit | FPL Tier 3 ceiling of 2,000 kW AC | Above it, FPL’s net metering tiers do not apply |
| Roof structure | Structural engineer of record | Ballasted versus attached racking, and any reinforcement |
Rooftop, Carport, or Ground-Mount: Which Costs Less per Watt?
A sound, unobstructed roof is usually the lowest-cost place to put commercial solar on an existing Florida building, because the structure the array sits on already exists. Carports add steel and foundations, and the analysis of commercial solar carport cost in Florida covers that premium with its sources. Ground-mounting needs open land. The table lists the main limitation of each option.
Table 3. Mounting options compared
| Option | Cost position | Best fit | Where it falls short |
|---|---|---|---|
| Rooftop, attached or ballasted | Lowest structure cost where the roof is sound | Warehouses, big-box retail, schools, and offices with large low-slope roofs | Shares the roof’s service life; a roof replacement under the array means removal and reinstallation; limited by setbacks and rooftop equipment |
| Solar carport | Higher: adds structural steel, foundations, and more involved permitting | Parking-heavy sites, or roofs that are too small, too old, or crowded | Highest structure cost; trenching and parking disruption during construction |
| Ground-mount | Site-dependent: no roof limits, but adds foundations, fencing, and trenching | Campuses and industrial sites with spare buildable land | Uses land; needs vegetation management and longer conductor runs |
Rooftop solar has limits worth stating plainly. It adds penetrations or ballast load that must be coordinated with the roof system and its warranty, and it reduces energy charges more reliably than demand charges, as the next section explains. Arrays are designed to rated wind speeds; storms can exceed them, and warranties carry exclusions. A statewide contractor built for occupied buildings may not be the lowest bidder on a small, simple roof.
What Drives Commercial Solar Payback in Florida?
Payback on a Florida commercial array depends on the value of each solar kWh, and that value depends on the building’s rate class. On FPL’s October 2026 business rate sheet, a small non-demand GS-1 account pays about 12.7 cents per kWh in combined per-kWh base, fuel, and clause charges, before adjustment credits, taxes, and fees. A GSD-1 demand account pays about 6.3 cents per kWh in per-kWh charges, plus a $12.70 per kW demand charge and several clause charges billed per kW. GSLD-1 pays about 5.6 cents plus $15.12 per kW; FPL’s tariff index assigns GSD-1 to 25 to 499 kW of demand and GSLD-1 to 500 to 1,999 kW.
The same array at the same price per watt therefore offsets roughly half as much per kWh on a GSD-1 account as on GS-1. A demand customer’s bill is partly set by peak measured demand, which a brief dip in solar output can leave unchanged. The guide to Florida net metering rules for commercial accounts explains how FPL bills demand on net-metered accounts and how excess credits roll forward and are settled at year end. Battery storage can target demand charges on some tariffs, but it does not pay back on every rate structure.
Table 4. Payback drivers
| Driver | How it moves payback | Source and date |
|---|---|---|
| Rate class | Sets the per-kWh value of solar: about 12.7 cents (GS-1), 6.3 cents (GSD-1), 5.6 cents (GSLD-1), rounded | FPL business rates, Oct. 2026 |
| Installed price per watt DC | National range from $1.77 (modeled) to about $2.40 to $3.10 (reported medians by size) | SEIA / Wood Mackenzie Q3 2026; Berkeley Lab Aug. 2026 |
| Federal credit and depreciation | Reduce net cost where the owner qualifies; construction-start and in-service dates apply | IRS Notice 2025-42; SEIA depreciation summary |
| Self-use versus export | Exported kWh are credited under the utility tariff; year-end excess is settled at a lower rate | PSC Rule 25-6.065; FPL tariff |
| Roof remaining life | A roof that fails before the array adds a remove-and-reinstall cost | Roof consultant’s report |
| O&M and inverter replacement | Ongoing costs over the analysis period | O&M contract; manufacturer warranties |
| Production | Depends on tilt, azimuth, shading, soiling, and degradation | Designer’s production model |
A payback number is only as good as these inputs, so ask which rate class, production model, and degradation rate were used, and whether a roof or inverter replacement is included. An operations and maintenance agreement is where the O&M figure gets pinned down, and commercial solar financing options change the cash-flow picture without changing what each kWh is worth.
What Changes When Rooftop Solar Goes on an Occupied Florida Building?
On an occupied building, the roof decision comes first. A rooftop array and the membrane under it share a service life, so a roof with eight years left under modules expected to produce for decades means budgeting a remove-and-reinstall in the middle of the array’s life. Advanced Green Technologies was founded by Advanced Roofing, whose commercial re-roofing services can replace the roof first. A roof and drone solar survey documents roof condition before layout.
Construction is sequenced around the tenants. Crane picks are scheduled outside business hours where the site allows, work zones are kept back from roof edges with guardrails or warning lines, and the electrical tie-in shutdown is scheduled with the property manager in advance. FPL requires Tier 2 and Tier 3 customers to pay an application fee and provide proof of insurance, and larger systems can trigger a utility study.
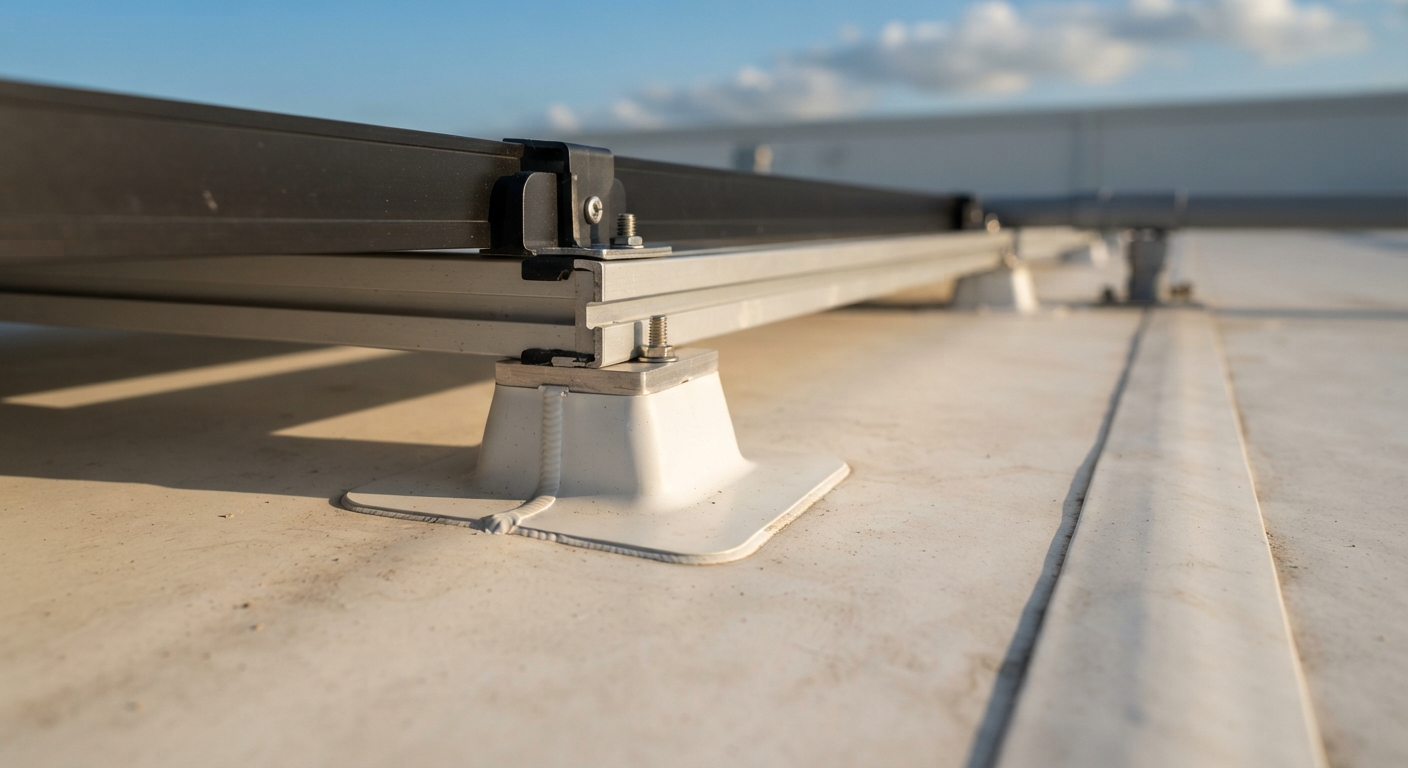
Florida adds wind and corrosion requirements that a national benchmark does not price. In Miami-Dade and Broward, the High-Velocity Hurricane Zone provisions of the Florida Building Code and product approval requirements apply to roof attachments, and the engineer of record determines design wind pressures for the array. On coastal sites, racking hardware and fasteners need corrosion resistance matched to salt exposure. These requirements add cost per watt that a generic reference system does not carry.
Which Tax Credits, Rules, and Code Dates Affect the Price? (As of November 18, 2026)
Federal credit timing now drives schedule decisions. IRS Notice 2025-42 explains that, under the One Big Beautiful Bill Act, solar facilities that begin construction after July 4, 2026 must be placed in service by December 31, 2027 to claim the Section 48E credit. Construction begins under a physical work test, such as installing racking on site; planning, permitting, and financing do not count. Projects that began construction on or before July 4, 2026 follow a four-year continuity safe harbor.
Two more federal items affect net cost. IRS Notice 2026-15 sets interim rules for the prohibited foreign entity restrictions that now apply to Section 48E, which affect equipment sourcing. SEIA’s depreciation summary reports that the same law restored 100% bonus depreciation for qualified property acquired after January 19, 2025, with the depreciable basis reduced by half of any investment credit claimed. Eligibility is a question for a tax advisor; the guide to the commercial solar tax credit deadline covers the timing in more depth.
Florida adds a property tax provision, a sales tax provision, and a code date. Section 193.624, Florida Statutes excludes 80% of the just value attributable to a renewable energy source device from assessment on nonresidential property, for devices installed on or after January 1, 2018, and the 2017 amendments expire December 31, 2037. The Florida Department of Revenue’s Tax Information Publication 19A01-09 describes the sales and use tax exemption for solar energy systems and their components under Section 212.08(7)(hh). The 9th Edition Florida Building Code is scheduled to take effect December 31, 2026, and the permit application date generally sets which edition governs; confirm with the building official and the Florida Building Commission.
Decision Checklist: What to Settle Before Signing a Rooftop Solar Proposal
The checklist below is written to be forwarded. Each item names the person who should answer it, because a payback projection that these roles have not checked is a sales figure. It applies to Duke Energy Florida and TECO accounts too, with the tariff names changed.
- CFO or owner: confirm the rate class and pull 12 months of bills and interval data before comparing bids.
- Facility manager: obtain a roof condition report with cores or a moisture survey, and the roof warranty terms for penetrations.
- Solar designer: provide the layout, DC and AC ratings, net metering tier, and a production model with degradation stated.
- Structural engineer of record: confirm roof capacity and attachment design wind pressures, including HVHZ requirements.
- Tax advisor: confirm credit eligibility, required construction-start and placed-in-service dates, and depreciation.
- Procurement or asset manager: compare bids on price per watt DC with identical scope, listing exclusions such as switchgear, roof work, and study fees.
- Property manager: approve staging, crane picks, and shutdown windows with tenants before mobilization.
Frequently Asked Questions
How much does commercial rooftop solar cost per watt in Florida?
No public dataset reports a Florida-only commercial price. National benchmarks run from $1.77 per watt DC, the SEIA and Wood Mackenzie modeled commercial average for Q2 2026, to Berkeley Lab’s 2025 reported medians of about $2.40 per watt for systems above 100 kW and $3.10 per watt for systems of 100 kW or less. Florida site conditions move a bid within or above that range.
What size solar system does my business need?
The smallest of three limits sets it: usable roof area, annual consumption, and the utility’s net metering rules. FPL requires a net-metered system to be estimated to produce less than 115% of annual kWh consumption, and its net metering tiers stop at 2,000 kW AC. Size comes from interval data and a production model, checked against the roof structure.
What is the payback period for commercial solar in Florida?
There is no single figure. Payback depends on net cost after any credits and depreciation, rate class, self-use versus export, production, O&M, and roof timing. On FPL’s October 2026 rates, a solar kWh offsets about 12.7 cents on a GS-1 account and about 6.3 cents on a GSD-1 demand account, which changes payback substantially at the same price per watt.
Is rooftop solar cheaper than a solar carport?
Usually, where the roof is sound, because a carport adds structural steel, foundations, and more involved permitting. A carport can still be the better choice when the roof is too small, too old, or crowded with equipment, or when covered parking has value to the site. Compare both on lifetime cost per kWh, with roof replacement included for the rooftop option.
Does solar reduce demand charges on an FPL bill?
Not reliably. Demand charges on FPL demand rate classes are billed on the highest measured demand in the billing period, and a short drop in solar output during that peak can leave the figure unchanged. Solar reduces the per-kWh portion of the bill more dependably. Battery storage can target demand on some tariffs, depending on the rate structure and load profile.
Can a business still claim the federal solar tax credit in 2026?
Possibly, depending on timing. Under IRS Notice 2025-42, solar facilities that begin construction after July 4, 2026 must be placed in service by December 31, 2027 to claim the Section 48E credit, and projects that began earlier follow a four-year continuity safe harbor. Prohibited foreign entity restrictions also apply. A tax advisor determines whether a project qualifies.
What a Defensible Florida Rooftop Solar Budget Looks Like
A commercial rooftop solar budget in Florida holds up when the price per watt is tied to a named source and a defined scope, the system size is set by the roof, the consumption, and the net metering tier, and the payback model uses the building’s actual rate class. National benchmarks bracket what owners pay, and Florida wind design, roof condition, and interconnection explain the distance to a bid. The rate class decides what each solar kWh is worth, which is why two buildings with identical arrays can see very different paybacks. Settle the roof, tariff, and tax timing first.
Written by The Technical Team at Advanced Green Technologies. Founded in 2007, Advanced Green Technologies is 100% employee-owned, has installed more than 380 megawatts of solar, and was ranked the #1 commercial and industrial EPC contractor in Florida on Solar Power World’s 2026 Top Solar Contractors list (see the 2026 ranking).
To price a rooftop array against your building’s roof, rate class, and schedule, request a free commercial solar assessment or call (888) 735-2641.